I’m a big fan of FiveThirtyEight’s weekly puzzle, the Riddler, which has an interesting mix of puzzles with a mathematical flavor. This week’s puzzle asks you to pick the best starting score for a tennis game against a much stronger opponent, and it has a very neat solutions with iterative calculations (circular references) in Excel.
Here’s the full puzzle:
Your wish has been granted, and you get to play tennis against Roger Federer in his prime in the Wimbledon final. You have only a 1 percent chance to win each point, but Roger, sporting gentleman that he is, offers to let you name any score and begin the match at that point. (So, if you’ve entertained a fantasy of storming back after being down three match points in the fifth set, now’s the time to live it.) What score can you name that gives you the best chance to win, and what is your chance of winning the title?
Now, if you know tennis scoring, there are really only a few potential candidates for where you’d want to start – but with some help from Excel, it’s not hard to work out the odds from any starting score.
Start by looking at a game. You need to score 4 points and be ahead by at least 2 points to win (ignore the weird naming convention). If P(a,b) is your probability of winning when you’re on a points and your opponent is on b points, then as long as the game hasn’t ended, we have P(a,b) = 1% * P(a+1,b) + 99% * P(a,b+1). Filling in the win conditions (in pink) and this formula (in blue) gives you most of the grid below. The last step is to note that P(3,3) = P(2,2), since in each case the players are tied, and the first one to pull ahead by 2 points wins. If you add this in as the green formula with iterative calculations on, you get the odds of winning a game from any starting point:
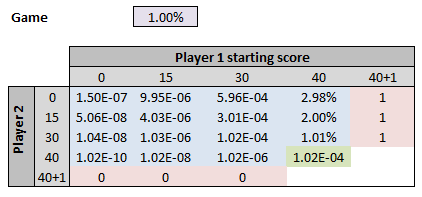
[Note: I’ve set the number formatting to be a % as long as it’s above 1% and scientific notation below that, since some of the odds are going to get VERY tough. You can use this custom number format code to get this result: [<0.01]0.00E+00;[>=0.01]0.00% ]
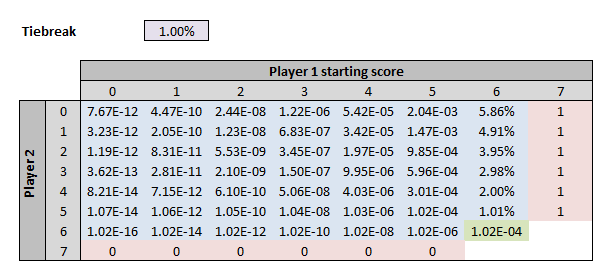
You can do the same thing to figure out who will win a tiebreaker game (first to 7 points and a 2-point lead):
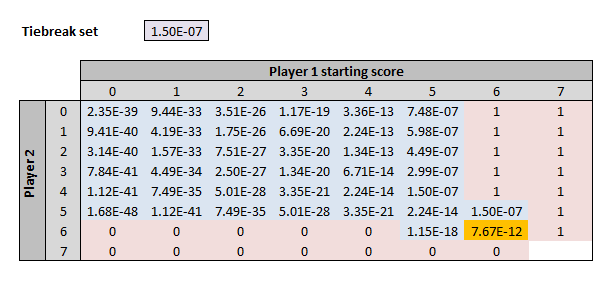
And once you know the odds of winning a game and a tie-breaker, you can work out the odds of winning a normal set (i.e. one with a tie-breaker) – just replace the 1% in purple cell with the 1.50 x 10^-7 odds of winning a game, and link the 7.67 x 10^-12 odds of winning a tie-breaker in the orange cell.
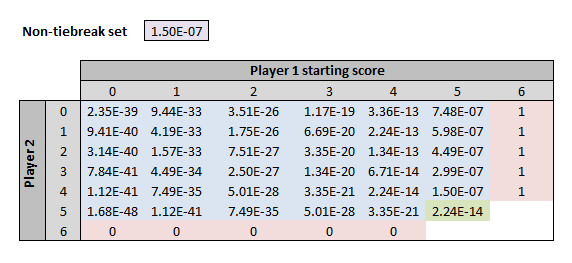
You can also work out the odds of winning a set without a tie-breaker, which works just like a game (first to 6 games and a 2-game lead):
And with that, you can put it all together to work out the odds of winning a match. This time, the purple cell has the odds of winning a (normal) set, 2.35 x 10^-39, and the orange cell has the odds of winning a fifth set (i.e. one without a tie-breaker) – although the two are almost identical.
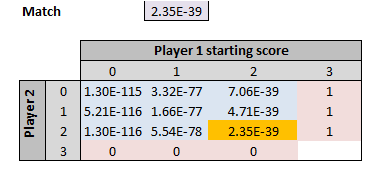
So the odds of beating Roger Federer in a full match are ~10^115 against – ouch!
As an aside, this definitely understates your odds of winning in real life – the second post from the wonderful What If blog (if you haven’t read it, you should) determines that the odds of guessing every question right on the SAT is ~4 x 10^-111, and concludes:
This means that the odds of acing the SAT by guessing are worse than the odds of every living ex-President and every member of the main cast of Firefly all being independently struck by lightning … on the same day.
…and the odds for SAT guessing are over 25,000 times better than the odds of winning a match according to these assumptions. Expect a lot more black swans than that in real life!
Anyway, back in ridiculous-theory land we want to know the odds starting from any score, so let’s work that out too…
Given a starting score (# of sets, games in current set, and points in current game for each player), we can easily look up the odds of the player winning the current game (in either the game table or the tie-breaker table above, depending on the set / game score). Then, the probability of them winning the current set will be
P(set) = P(game) * P(set|P1 wins current game) + (1 – P(game)) * P(set|P2 wins current game)
We’ve already got P(game), and we can look up the probability of winning the set in the relevant set table above. We can then do the same thing to go from the odds of winning the set to the odds of winning the match.
Finally, we need to list out all possible starting scores which have different odds of winning (we don’t need to list 40-40 and 30-30 in the same game, for example, because as explained above they have the same odds of victory). I leave constructing this list as an exercise for the eager reader (you can check your answer against my list in the Excel file attached, although I can’t guarantee I got it all right myself!).
Once we have the list, we add in the probability of winning the current game, set, and match using the formulas above, then sort by descending probability of winning the match. The result starts off like this:
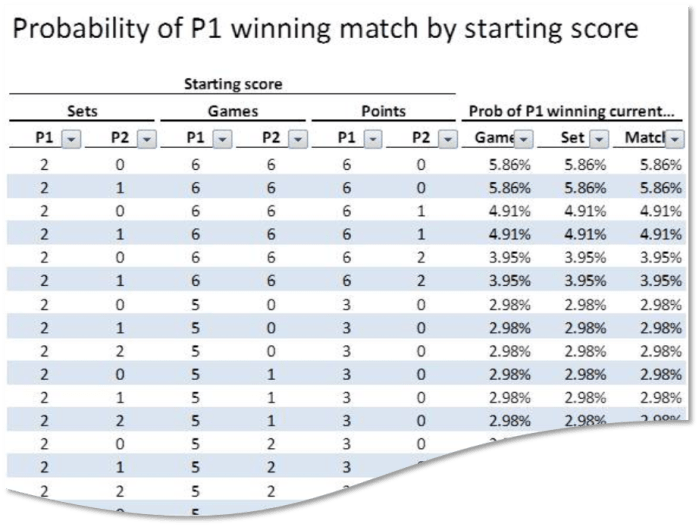
So, the best odds of winning come if we start off 2 sets up, 6 games each in the current set, and 6 points ahead in the tie-breaker, and the odds of victory are just below 6%. This makes sense, as if we win any of the next 6 points, we win the match. The odds in the next row, which is the same except that Roger has another set in hand, are almost identical – that’s because the odds of winning a set are so low (~10^-40) that if we don’t win the tie-breaker, we’re toast either way.
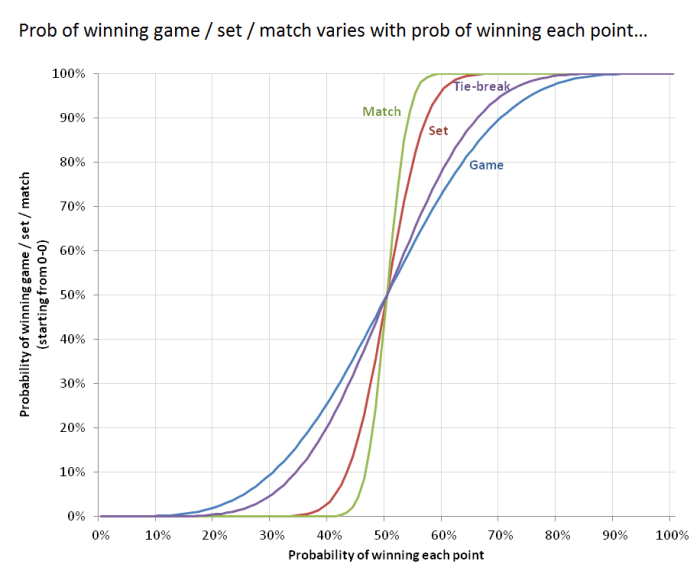
What if the split for any point was a more balanced 60 / 40? You’d expect to stand a reasonable chance of winning, but actually your odds are pretty dire – 26.4% chance to win a game, 3.4% to win a set, and just 0.4% chance to win a match. The chart below shows the odds of winning each type as a function of the probability of winning each point:
This model would be a lot more realistic if the odds of victory changed according to who was serving (a quick google suggests that between equally matched players, the one serving has about a 60-65% chance of winning the point), but I need to go and do other things now…
If you’d like to take a closer look at / correct likely errors in / expand my model, you can download my spreadsheet at the link below. Note that it doesn’t include the data table to create the chart, because the combination of the data table and the iterative calculations was making it run a bit too slowly…

Nice post, thanks Dim!
Any idea how you’d do it if you assumed the odds of winning consecutive points were correlated?
LikeLike
Thanks Levi – and good question. I can think of a few approaches, each with some disadvantages…
1. The simplest would be to model momentum within a game / set / match based on the current score or current margin – that way, there’s still only one probability to use in each grid cell, and you can mostly keep things the same.
2. To be more true to the question you asked, I think it would need to be path-dependent – e.g. if the game is at 40-30, the player who is behind might still be the one getting the ‘boost’ if they scored the last 2 points. You could model this with a table with a row for each possible path, e.g. 1-2-2-2-1, and the associated probabilities. It wouldn’t be too hard to generate every path up to, say, 20 points long that could happen in a game (and the odds of it going longer than that would be vanishingly small), and sum the probabilities over each.
3. That version still only allows for momentum within a game, which wouldn’t carry across. Listing out every path of points that could lead to winning a match would be effectively impossible, so the only thing I could think of to keep modeling momentum in this case would be to create a Monte Carlo simulation to run one match at a time, then run a big data table to estimate the probabilities. Obviously with probabilities in the range of 10^-115, that’s no use at all – but with a more realistic match-up, it might work.
LikeLike
Solid!
Yes, I was thinking Monte Carlo as well and don’t know whether it would give meaningful results without a gargantuan number of iterations. Correlation might increase the odds of the underdog winning the match by getting some good runs in, which could reduce the number of iterations required – but my guess is that it would not be down to a manageable number of iterations.
LikeLike
Thanks a lot Dim for your work and especially for this post ! Reading your blog revives my lost interest in math and statistics and I’m more willing to learn them in a spreadsheet context as you do in your posts.
I must confess, I did not dig deeper in this article and need to review it later, but I have a little suggestion about cumbersomeness of your model : why not use VBA for handling the iterations and calculation mode or even the formula and data table ?
Once more time, thanks a lot !!! Just want to know if you know some books or resources to learn math in spreadsheet context, i think it’s very fun !!!
Regards,
STEPHANE NTONGA
LikeLike
Hi Stephane,
I’m not sure if VBA would avoid the iterations – you could use a copy / paste macro instead of iterative calculations, but I think that would make it slower rather than faster. You might be able to use VBA to construct the table more easily, if you’re quick with VBA. I’m a lot quicker with formulas, so I generally go for very light-touch code and do as much of the heavy lifting in the spreadsheet as possible.
I don’t know of a lot of other places with my odd mix of statistics and spreadsheets, but a couple of places you could try are the Bacon Bits blog (http://datapigtechnologies.com/blog/), which has had some good posts on stats concepts before, and the past questions from ModelOff (http://www.modeloff.com/questions/), especially Snakes & Ladders and Monte Carlo.
Hope that helps.
Best,
Diarmuid
LikeLike