Unless you’ve been living under a rock for the past several years, you may have heard that partisan divisions are the new normal in US politics, with the exercise of the ‘nuclear option’ to confirm some Presidential appointments, the refusal by the Senate to hold a vote on the President’s nomination for the vacant Supreme Court seat, the brinksmanship around debt-ceiling negotiations (at the time of writing, that link goes to a disambiguation page on the term ‘United States debt-ceiling crisis’, the very existence of which kind of tells you all you need to know…), to name just a few examples.
Of course, it’s easy to think of examples of conflicts that have been in the news lately, and not so easy to get an objective view of long-term changes. So I thought it would be interesting to look at the question with some hard data on how the members of both parties actually vote. Voting data for the US Senate back as far as 1989 is very easily available through senate.gov, and similarly for the House.
For a warm-up, I took the 1989 and 2015 data (the oldest and the newest complete years) and looked at how often senators voted with their own party. To keep things simple for now, I just looked at votes where the two parties disagreed (i.e. the majority of Democrats voted one way, and the majority of Republicans voted the other way) – but it’s worth noting that even that filter changed a lot over time: the majorities of the two parties were on the same side in 64% of the votes in 1989, and that went down to 30% in 2015.
Here’s a summary for 1989. Each bar is one senator (blue for Democrats, red for Republicans), and shows the percentage of votes on which they aligned with the majority of the Democrats. The axis goes through 50%, so bars below the line are more aligned with the Republicans, and above the line are more aligned with the Democrats.
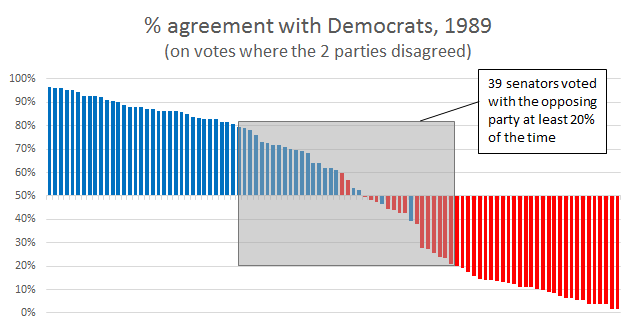
There are a few things worth pointing out here:
- The line goes relatively smoothly from close to 100% to close to 0% (with one big-ish jump from 38% to 28%, or 10% pts).
- 39 out of 100 senators aligned with the opposing party on at least 20% of votes where the parties disagreed.
- There wasn’t a single senator who voted with their party every time.
- 4 senators voted with the opposing party more often that with their own: Republicans Mark Hatfield (OR) and Jim Jeffords (VT) voted with the Democrats 60% and 57% of the time respectively; and Democrats Howell Heflin and Richard Shelby (both AL) voted with the Republicans 61% and 54% of the time respectively [1].
Now, here’s the same chart for 2015:
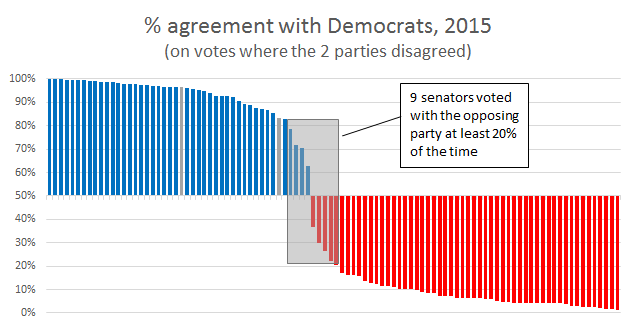
The differences compared to 1989 are very striking:
- Only 9 senators voted with the opposing party at least 20% of the time.
- No-one voted with the opposing party more than 37% of the time, which means there’s a 26% pt movement between the last Democrat, Joe Manchin (D-WV, 63% alignment with the Democrats) and the first Republican, Susan Collins (R-ME, 63% alignment with the Republicans).
- While there were technically two independents (the grey bars), they clearly aligned with the Democrats (Bernie Sanders, VT, was 96% aligned, and Angus King, ME, was 83% aligned).
But it’s not just close to the middle that the big changes came – look how much flatter the line is for the first 40 senators on each side. The average percent alignment with their party went from 79% for the Democrats in 1989 t0 93% in 2015, and from 80% for the Republicans in 1989 to 91% in 2015. Three senators never voted with the majority of the opposing party against their own, all Democrats: Kirsten Gillibrand (NY), Ed Markey (MA), and Elizabeth Warren (MA) [2]. There’s a stretched-out version of the 2015 chart down below with everyone’s name on it.
[Here’s an interesting aside: the two Republicans who show most independence from their party in their voting habits (Susan Collins from Maine, 63% aligned; and Mark Kirk from Illinois, 70% aligned) have also both publicly disavowed Donald Trump – here for Collins, and here for Kirk. So could this analysis give us a hint as to who might be the next Republican senator to ‘dump Trump’?
The next in line would be Kelly Ayotte (NH), who was 74% aligned to the Republican party in 2015 – but since she’s standing for re-election in a seat rated as a toss-up, it seems likely that any public position she takes on Trump will be at least heavily influenced by tactical considerations as well as principled ones. So if I had to bet, I might look at the next person along, Lisa Murkowski (AK), who is also up for election, but in a much safer seat. That said, Murkowski was 78% aligned to the Republican party in 2015, which is already a lot more in-line than Collins or even Kirk – so don’t hold your breath waiting for the announcement.
UPDATE: Less than 12 hours after I published this post, Kelly Ayotte told CNN that she does not endorse Trump – but will vote for him. I’ll count that as half marks for my prediction…]
So in short, the two parties have gone from agreeing with each other in the majority almost 2/3 of the time, and having members willing to cross the aisle when the parties disagreed, to agreeing with each other less than 1/3 of the time, and being much more rigidly party-aligned when they do disagree – so maybe the fears of polarization in Washington are quite well-founded in the data after all.
In my next post on this topic, I’ll look at a different way to analyse the data that gives a richer view of the disagreements between any pair of senators, rather than just collapsing everyone to the one-dimensional party view… also, I’m going to post the solution to the MasterMind challenge next week, so last chance to get your answers in!
Caveats!
I’m trying to balance my inner academic (which wants more caveats, disclaimers, and cautions in every sentence) against my inner writer (which wants to title this post ‘This one weird trick lets me predict the next Senator to #dumpTrump with a spreadsheet’ – OK, not really, but it would like to see some more reductive statements), so I’ve settled on putting some general words of warning above the footnotes, but after the end of the main piece. You are welcome to skip if this is not your thing…
Perhaps the most important caveat on any wider truth we might try to infer from voting data is selection bias: we only have voting data on topics that have been put to a vote, and those are not chosen from a perfectly uniform random distribution over the set of ideas (whatever that might look like). For example, a hypothetical senator might look solidly Republican if the only votes were about fiscal issues, and solidly Democrat if the only votes were about social issues – and so their apparent party alignment would depend significantly on the mix of topics voted on in a given year. Perhaps more importantly, since the majority party sets the agenda, it seems reasonable to expect that certain topics, especially those on which the majority is most divided, won’t be voted on at all. An increase in that kind of tactical agenda setting could account for a significant amount of the apparent increase in party alignment. In other words, if you take the 1989 senate and filter out all the votes on which the majority party is most divided, you will get what looks like a much more partisan senate without changing how any individual feels about any topic.
One further point worth noting is that I have assumed no signal value from whether a person votes on a given topic, which is surely at least a little unrealistic (i.e. you might expect some correlation between a topic’s importance to a senator and their likelihood to participate in votes related to it) – but the rate of missed votes in the senate is very low (2.2% in 1989 and 2.8% in 2015), so I assume this isn’t a material.

[1] It’s hard to imagine today that Alabama, which has voted Republican in every presidential election for almost 40 years, and looks set to do so again this year, had two Democratic senators as recently as 1989 – but actually, it was a solidly blue state in senate elections for decades before that. Richard Shelby won his election against the only Republican senator elected in Alabama since the 1870s. Richard Shelby changed party to the Republicans in 1994, Jeff Sessions (another Republican) was elected in 1996, and the two have held their seats since then.
[2] At first blush, it looks like the Republicans have retained a sliver more independence. I suspect that may just be a luxury available to the majority party (i.e. you can afford one or two defectors and still win). Something to investigate with more data later on, perhaps…

I’ve taken an interest in DW-NOMINATE for about a decade now, which covers similar ground, but this explains the issues well for the lay person.
Now a few things changed since 1989. In 2015, debate on just four bills and resolutions comprised half the dataset: the congressional budget, Keystone XL, federal education policy and defunding Obamacare and Planned Parenthood. Back in 1989, Senate votes were on a wider range of resolutions, often in traditionally non- and bi-partisan topics concerning foreign, defence and immigration policy. Thus there are more close votes in 2015, and fewer votes that express the opinion of the Senate as a whole. Say a close vote is 35-65 Yes; there were 108 in 1989 but twice that number, 220, in 2015, whereas 95+ Yes votes went down from 73 to 32, partly due to nominations at the beginning of the Bush presidency in 1989.
LikeLike
Hello from Sydney! Have you seen this representation for the congress’s move to partisanship? Outside of the realm of excel, but easy to understand. https://www.washingtonpost.com/news/wonk/wp/2015/04/23/a-stunning-visualization-of-our-divided-congress/
LikeLike
Justin – yes, I’ve seen that, very cool visual (although I take issue a little with the methodology). Who says it’s outside the realm of Excel?? Part 2 of this post includes a visualization that’s sort-of-kind-of my version of that (not as sexy, admittedly…). Hope all’s well in Sydney!
Edward – thanks for the interesting extra color on the changing politics over the period! I’ve read a little about DW-NOMINATE, but don’t know much about it.
LikeLike